
The Woodlands housing market entered fall 2026 with more homes available to buyers and a higher median sales price than a year ago. In September, active listings increased 27% year over year while the median sales price rose 6% to $574,500.
At the same time, homes took longer to sell and closed sales declined. Months of inventory reached 5, giving buyers more options while increasing the importance of strategic pricing and presentation for sellers.
More Homes Are Available to Buyers
Active listings in The Woodlands reached 602 in September 2026, up from 475 in September 2025, a 27% year-over-year increase.
The increase continues the inventory growth seen in August, when active listings were 16% higher than the previous year.
For buyers, 602 active listings mean more properties to consider and potentially more time to compare available options. For sellers, the increase means greater competition from other homes on the market.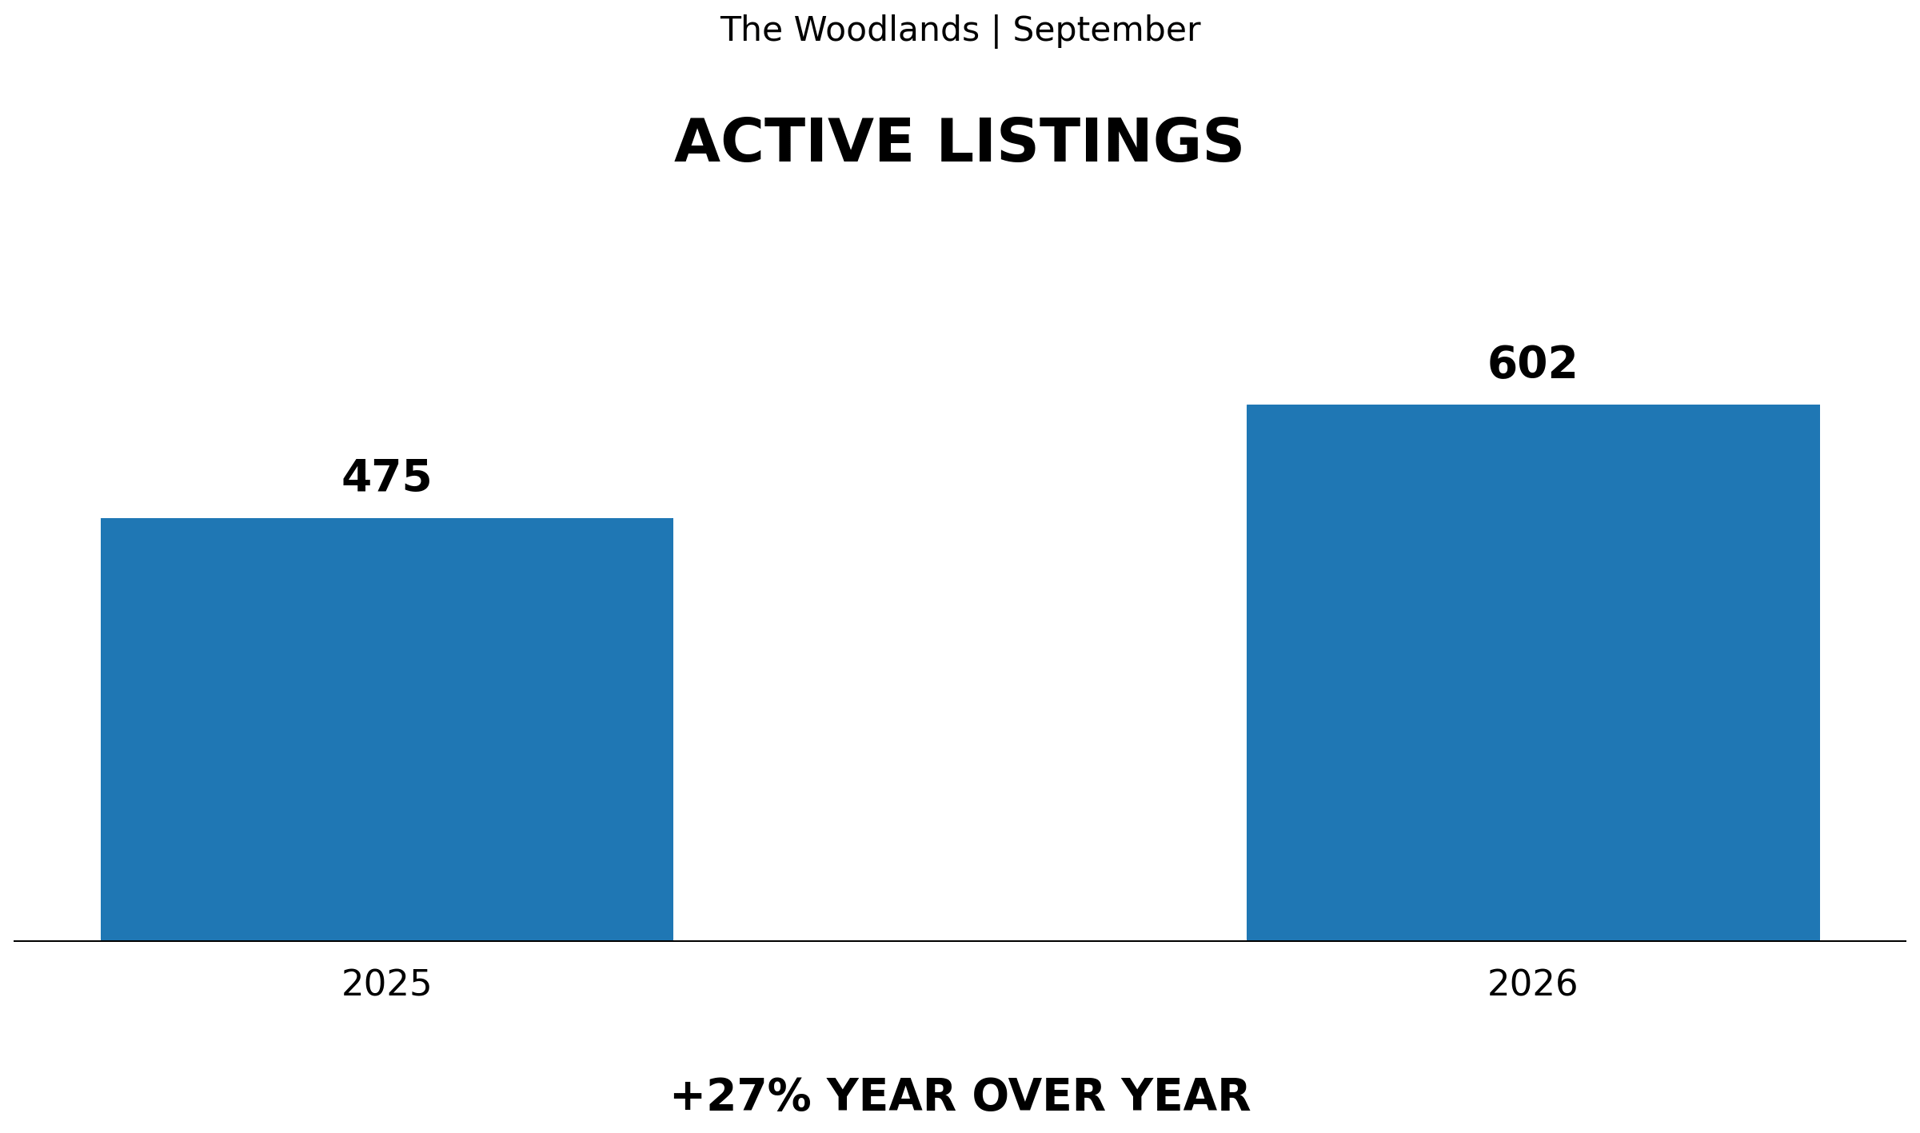
Median Sales Price Increases 6%
The median sales price reached $574,500 in September 2026, compared with $540,000 in September 2025, representing a 6% year-over-year increase.
That marks a notable change from August, when the median sales price was 13% below the previous year's level.
Month-to-month and year-over-year changes in median price can be influenced by the mix of properties sold, including differences in size, location and price point. The September increase therefore does not mean every home in The Woodlands appreciated by 6%, but it provides an important indicator of overall market activity.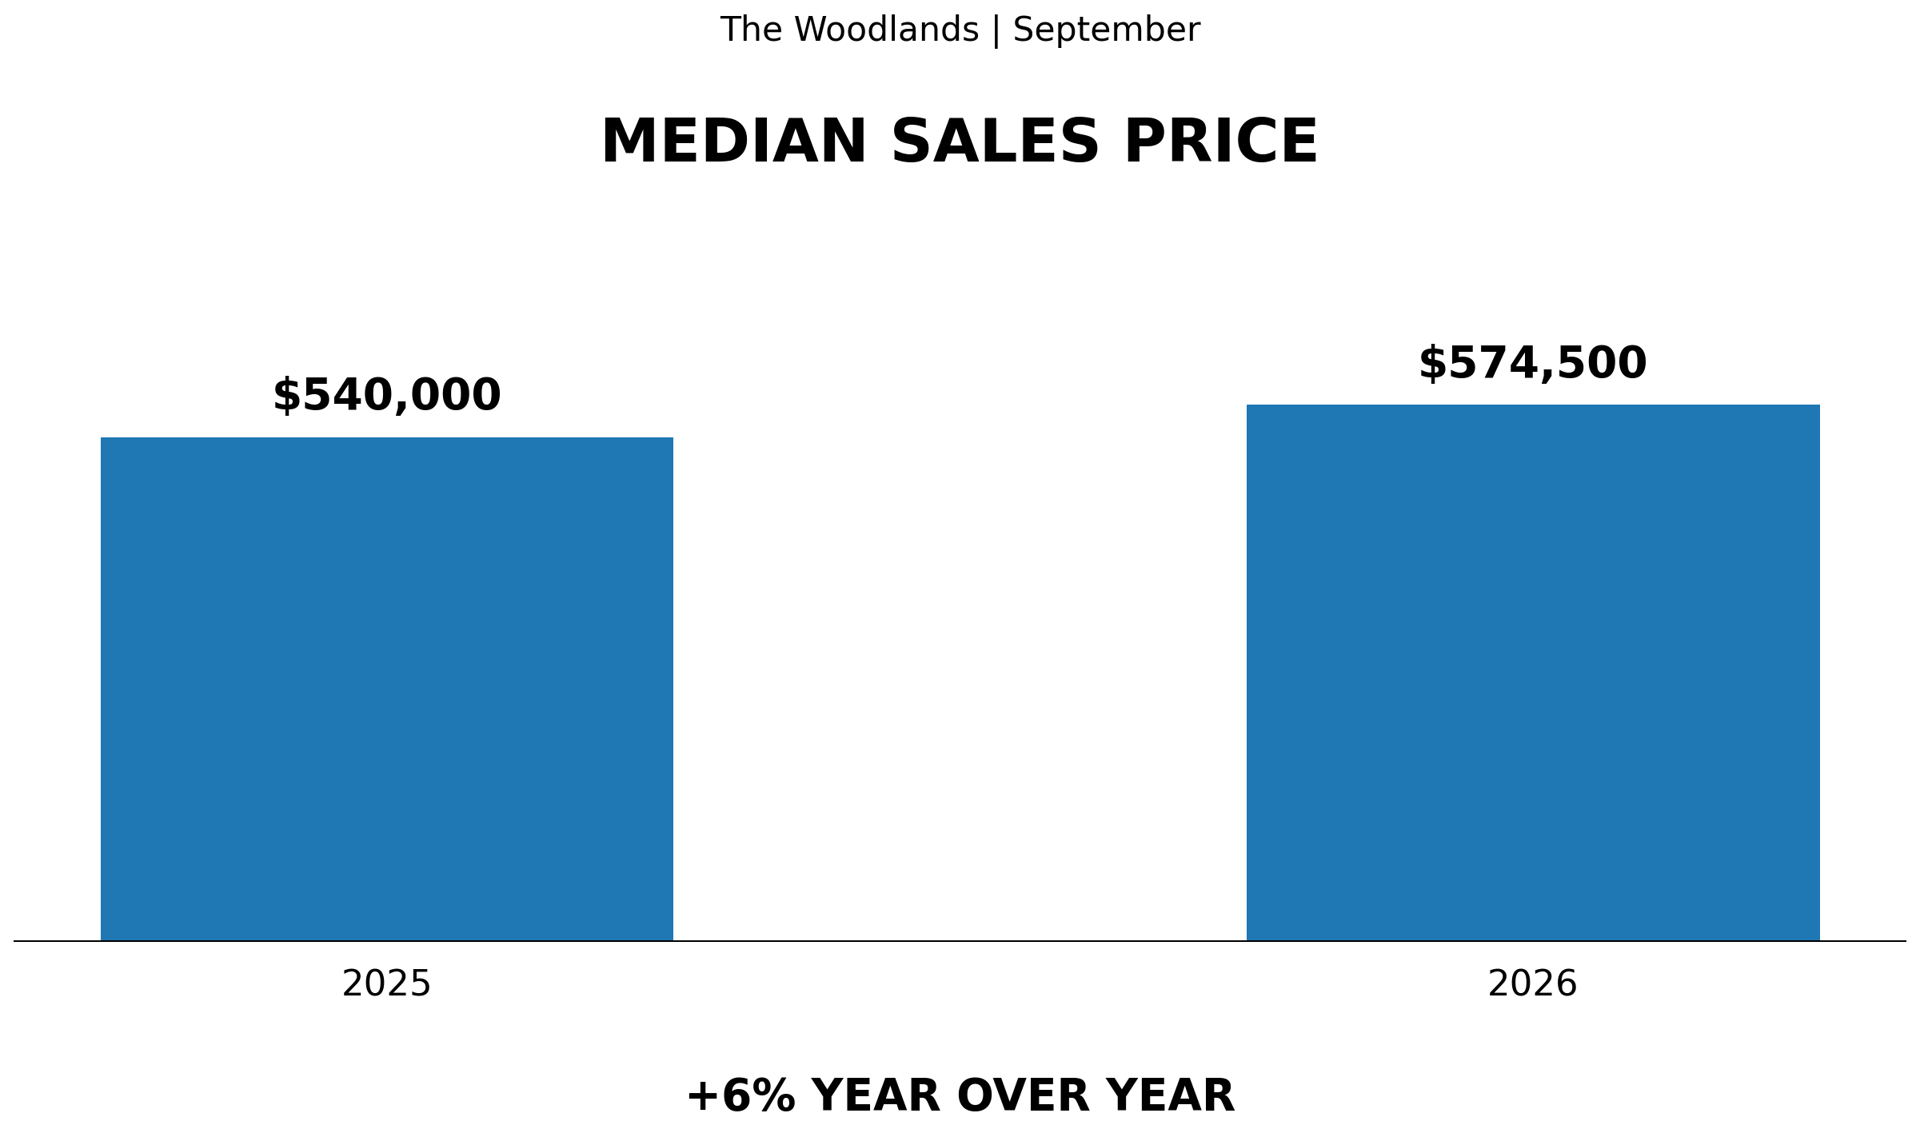
Months of Inventory Climbs to 5
The Woodlands recorded 5 months of inventory in September 2026, compared with 3.7 months in September 2025. That's an increase of approximately 35% year over year.
August recorded 4 months of inventory, so September's figures show that available supply continued to expand as the market moved into fall.
More inventory gives buyers a wider selection of homes and creates an environment in which sellers need to pay close attention to competing listings, property condition and pricing.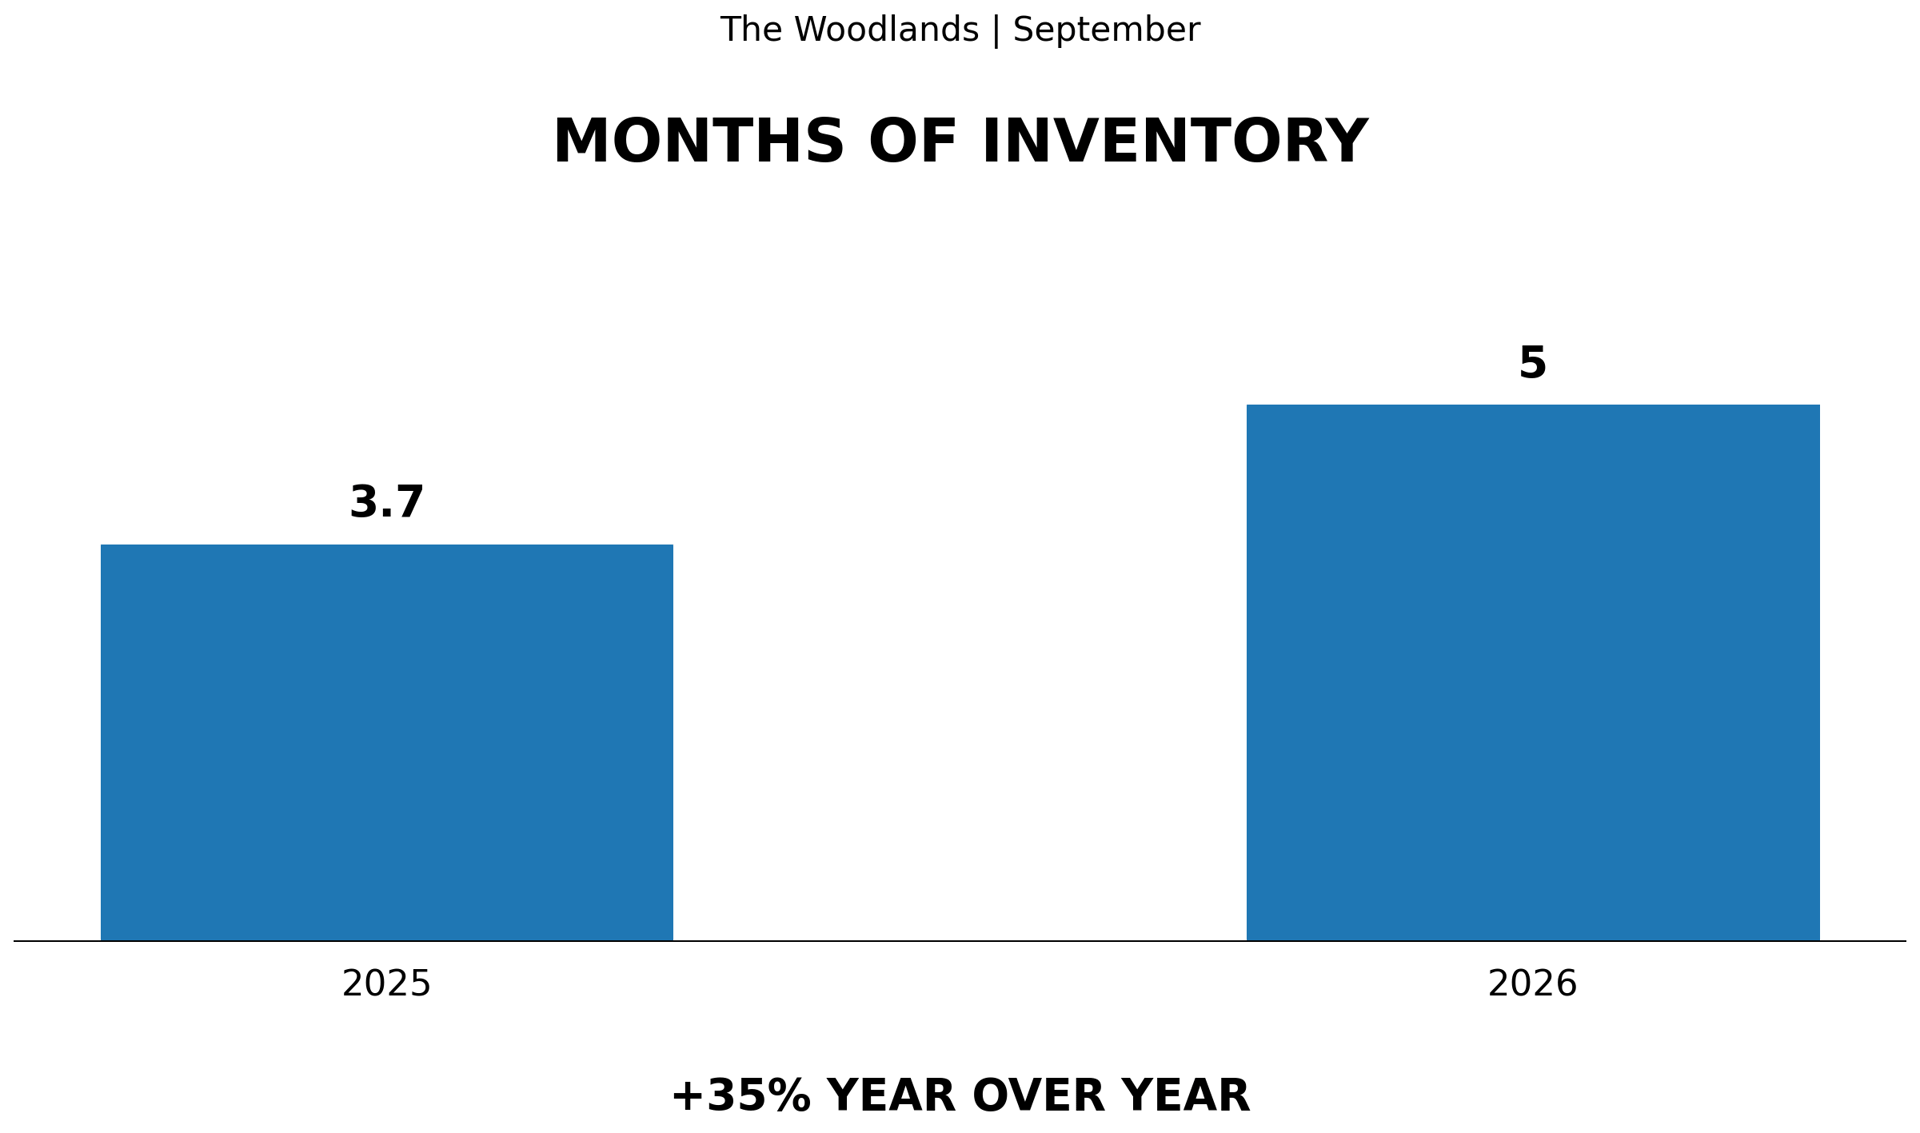
Homes Are Taking Longer to Sell
Average cumulative days on market, or CDOM, increased from 56 days in September 2025 to 70 days in September 2026, a 25% increase.
The change indicates that homes are generally requiring more time to move from listing to sale than they did a year ago.
For sellers, the longer timeline reinforces the importance of entering the market with a price and presentation that reflect current conditions rather than relying on expectations from a lower-inventory market.
Closed Sales Decline 7%
There were 120 closed sales in September 2026, compared with 129 in September 2025, representing a 7% year-over-year decline.
While fewer transactions closed, the decline was substantially smaller than in August, when closed sales were down 20% year over year.
Taken alongside rising inventory and longer market times, September's sales figures point to a market where buyers have more choices and transactions may take longer to come together.
Median Lease Price Declines 6%
The median lease price in The Woodlands was $2,500 in September 2026, down from $2,650 in September 2025, a 6% decrease.
That represents another reversal from August, when the median lease price increased 8% year over year.
For households considering whether to rent or purchase in The Woodlands, changes on both sides of the market provide useful context when evaluating their options.
What the September Numbers Mean for The Woodlands
September's numbers show a housing market with more inventory, higher median sale prices and longer selling times than a year ago.
For buyers, the 27% increase in active listings means greater selection. For sellers, the combination of more competing inventory and a 25% increase in average CDOM makes accurate pricing and strong presentation increasingly important.
The increase in median sales price is also significant after August's year-over-year decline, demonstrating why individual monthly statistics are best considered as part of a broader trend rather than in isolation.
As The Woodlands moves further into the fall market, inventory, days on market, closed sales and pricing will be important indicators to watch. Individual properties can perform very differently depending on location, condition, price point and features, so community-wide statistics should be used as market context rather than as a valuation of a particular home.